using System;
using System.Drawing;
using System.Windows.Forms;
using Steema.TeeChart;
using Steema.TeeChart.Drawing;
using Steema.TeeChart.Functions;
using Steema.TeeChart.Styles;
using Steema.TeeChart.Tools;
namespace TestProject
{
/// <summary>
/// 메인 폼
/// </summary>
public partial class MainForm : Form
{
//////////////////////////////////////////////////////////////////////////////////////////////////// Field
////////////////////////////////////////////////////////////////////////////////////////// Private
#region Field
/// <summary>
/// 콘솔 배열
/// </summary>
private string[] consoleArray = { "Wii", "PS3", "X360", "PSP", "DS" };
/// <summary>
/// 단위 카운트 배열
/// </summary>
private int[] unitCountArray = { 217235, 162239, 101889, 161156, 609136 };
/// <summary>
/// 가격 배열
/// </summary>
private double[] priceArray = { 249, 299, 249, 169, 149 };
/// <summary>
/// 영역
/// </summary>
private Area area;
/// <summary>
/// 평균 라인
/// </summary>
private Line averageLine;
/// <summary>
/// 주석 1
/// </summary>
private Annotation annotation1;
/// <summary>
/// 주석 2
/// </summary>
private Annotation annotation2;
#endregion
//////////////////////////////////////////////////////////////////////////////////////////////////// Constructor
////////////////////////////////////////////////////////////////////////////////////////// Public
#region 생성자 - MainForm()
/// <summary>
/// 생성자
/// </summary>
public MainForm()
{
InitializeComponent();
Text = "Area 클래스 : 판매 대 가격 영역 차트 만들기";
#region 티차트를 설정한다.
this.tChart.Panel.Pen = new ChartPen(Color.Black);
this.tChart.Header.Visible = true;
this.tChart.Header.Font.Size = 10;
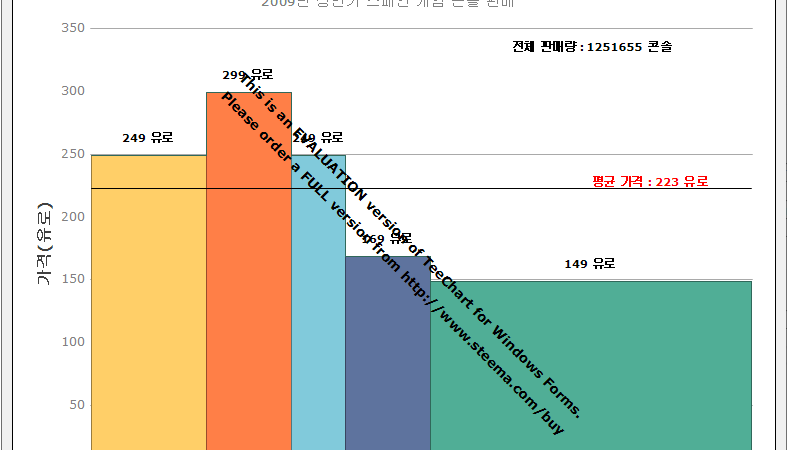
this.tChart.Header.Text = "2009년 상반기 스페인 게임 콘솔 판매";
this.tChart.Legend.Visible = false;
this.tChart.Axes.Left.Title.Font.Bold = true;
this.tChart.Axes.Left.Title.Text = "가격(유로)";
this.tChart.Axes.Left.Increment = 50;
this.tChart.Axes.Bottom.Grid.Visible = false;
this.tChart.Axes.Left.SetMinMax(0, 350);
#endregion
#region 영역을 설정한다.
this.area = new Area();
this.area.Stairs = true;
this.area.ColorEach = true;
this.area.Marks.Style = MarksStyles.Value;
this.area.Marks.Transparent = true;
this.area.Marks.Font.Bold = true;
this.area.Marks.Visible = true;
this.tChart.Series.Add(this.area);
#endregion
#region 영역에 데이터를 추가하고 평균 라인을 설정한다.
double temporaryValue = 0;
for(int i = 0; i < this.consoleArray.Length; i++)
{
this.area.Add(temporaryValue, this.priceArray[i], this.consoleArray[i]);
temporaryValue += this.unitCountArray[i];
}
this.averageLine = new Line(this.tChart.Chart);
this.averageLine.Color = Color.Black;
this.averageLine.Function = new Average();
this.averageLine.DataSource = this.area;
this.area.Add(temporaryValue, this.priceArray[this.priceArray.Length - 1]);
this.averageLine.XValues[this.averageLine.Count - 1] = temporaryValue;
#endregion
#region X축 레이블을 추가한다.
this.tChart.Axes.Bottom.Labels.Items.Clear();
for(int i = 0; i < this.area.Count - 1; i++)
{
double value = this.area.XValues[i] + ((this.area.XValues[i + 1] - this.area.XValues[i]) / 2);
AxisLabelItem item = this.tChart.Axes.Bottom.Labels.Items.Add(value, this.consoleArray[i]);
item.Font.Bold = true;
}
#endregion
Load += Form_Load;
Resize += Form_Resize;
this.tChart.AfterDraw += tChart_AfterDraw;
this.tChart.Zoomed += tChart_Zoomed;
this.tChart.UndoneZoom += tChart_UndoneZoom;
this.area.GetSeriesMark += area_GetSeriesMark;
}
#endregion
//////////////////////////////////////////////////////////////////////////////////////////////////// Method
////////////////////////////////////////////////////////////////////////////////////////// Private
//////////////////////////////////////////////////////////////////////////////// Event
#region 폼 로드시 처리하기 - Form_Load(sender, e)
/// <summary>
/// 폼 로드시 처리하기
/// </summary>
/// <param name="sender">이벤트 발생자</param>
/// <param name="e">이벤트 인자</param>
private void Form_Load(object sender, EventArgs e)
{
this.tChart.Draw();
}
#endregion
#region 폼 크기 조정시 처리하기 - Form_Resize(sender, e)
/// <summary>
/// 폼 크기 조정시 처리하기
/// </summary>
/// <param name="sender">이벤트 발생자</param>
/// <param name="e">이벤트 인자</param>
private void Form_Resize(object sender, EventArgs e)
{
this.tChart.Draw();
}
#endregion
#region TChart 그리기 후 처리하기 - tChart_AfterDraw(sender, graphics3D)
/// <summary>
/// TChart 그리기 후 처리하기
/// </summary>
/// <param name="sender">이벤트 발생자</param>
/// <param name="graphics3D">그래픽스 3D</param>
private void tChart_AfterDraw(object sender, Graphics3D graphics3D)
{
SetCustomMarkPosition();
SetAnnotation();
}
#endregion
#region TChart 확대시 처리하기 - tChart_Zoomed(sender, e)
/// <summary>
/// TChart 확대시 처리하기
/// </summary>
/// <param name="sender">이벤트 발생자</param>
/// <param name="e">이벤트 인자</param>
private void tChart_Zoomed(object sender, EventArgs e)
{
this.tChart.Draw();
}
#endregion
#region TChart 확대 취소시 처리하기 - tChart_UndoneZoom(sender, e)
/// <summary>
/// TChart 확대 취소시 처리하기
/// </summary>
/// <param name="sender">이벤트 발생자</param>
/// <param name="e">이벤트 인자</param>
private void tChart_UndoneZoom(object sender, EventArgs e)
{
this.tChart.Draw();
}
#endregion
#region 영역 시리즈 마크 구하기 - area_GetSeriesMark(series, e)
/// <summary>
/// 영역 시리즈 마크 구하기
/// </summary>
/// <param name="series">시리즈</param>
/// <param name="e">이벤트 인자</param>
private void area_GetSeriesMark(Series series, GetSeriesMarkEventArgs e)
{
e.MarkText = e.ValueIndex < this.area.Count - 1 ? $"{e.MarkText} 유로" : string.Empty;
}
#endregion
//////////////////////////////////////////////////////////////////////////////// Function
#region 주석 설정하기 - SetAnnotation()
/// <summary>
/// 주석 설정하기
/// </summary>
private void SetAnnotation()
{
int baseLeft = this.area.CalcXPos(this.area.Count - 2) +
((this.area.CalcXPos(this.area.Count - 1) - this.area.CalcXPos(this.area.Count - 2)) / 2);
Rectangle chartRectangle = this.tChart.Chart.ChartRect;
if(this.annotation1 == null)
{
this.annotation1 = new Annotation(this.tChart.Chart);
}
this.annotation1.Shape.CustomPosition = true;
this.annotation1.Shape.Left = baseLeft - 80;
this.annotation1.Shape.Top = chartRectangle.Top + 20;
this.annotation1.Shape.Transparent = true;
this.annotation1.Shape.Font.Bold = true;
this.annotation1.Text = $"전체 판매량 : {this.area.MaxXValue()} 콘솔";
if(this.annotation2 == null)
{
this.annotation2 = new Annotation(this.tChart.Chart);
}
this.annotation2.Shape.CustomPosition = true;
this.annotation2.Shape.Left = baseLeft;
this.annotation2.Shape.Top = this.averageLine.CalcYPos(0) - 15;
this.annotation2.Shape.Transparent = true;
this.annotation2.Shape.Font.Color = Color.Red;
this.annotation2.Shape.Font.Bold = true;
this.annotation2.Text = $"평균 가격 : {this.averageLine.MaxYValue()} 유로";
}
#endregion
#region 커스텀 마크 위치 설정하기 - SetCustomMarkPosition()
/// <summary>
/// 커스텀 마크 위치 설정하기
/// </summary>
private void SetCustomMarkPosition()
{
for(int i = 0; i < this.area.Marks.Positions.Count; i++)
{
double baseLeft = this.area.XValues[i] + ((this.area.XValues[i + 1] - this.area.XValues[i]) / 2);
this.area.Marks.Positions[i].Custom = true;
this.area.Marks.Positions[i].LeftTop.X = this.tChart.Axes.Bottom.CalcXPosValue(baseLeft) - (this.area.Marks.Positions[i].Width / 2);
this.area.Marks.Positions[i].LeftTop.Y = this.area.CalcYPos(i) - 25;
}
this.area.Marks.Arrow.Visible = false;
this.area.Repaint();
}
#endregion
}
}
