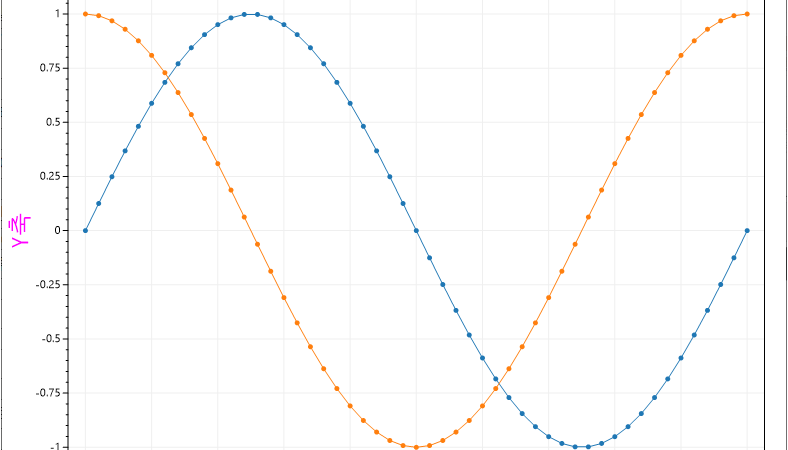
■ Y축을 숨기는 방법을 보여준다. ▶ MainForm.cs
1 2 3 4 5 6 7 8 9 10 11 12 13 14 15 16 17 18 19 20 21 22 23 24 25 26 27 28 29 30 31 32 33 34 35 36 37 38 39 40 41 42 43 44 45 46 47 48 49 50 51 52 53 54 55 |
using System.Windows.Forms; using ScottPlot; using ScottPlot.Plottable; using ScottPlot.Renderable; namespace TestProject { /// <summary> /// 메인 폼 /// </summary> public partial class MainForm : Form { //////////////////////////////////////////////////////////////////////////////////////////////////// Constructor ////////////////////////////////////////////////////////////////////////////////////////// Public #region 생성자 - MainForm() /// <summary> /// 생성자 /// </summary> public MainForm() { InitializeComponent(); Plot plot = new Plot(800, 600); SignalPlot signalPlot1 = plot.AddSignal(DataGen.Sin(51, mult : 1)); signalPlot1.YAxisIndex = 0; SignalPlot signalPlot2 = plot.AddSignal(DataGen.Cos(51, mult : 100)); signalPlot2.YAxisIndex = 2; Axis additionalYAxis = plot.AddAxis(Edge.Left, axisIndex : 2); additionalYAxis.Label("추가 Y축"); additionalYAxis.Color(signalPlot2.Color); plot.YAxis.IsVisible = false; plot.YAxis.Color(signalPlot1.Color); plot.YAxis.Label("Y축"); this.formsPlot.Reset(plot); this.formsPlot.Refresh(); } #endregion } } |
TestProject.zip
■ 위쪽 Y축을 사용하는 방법을 보여준다. ▶ MainForm.cs
1 2 3 4 5 6 7 8 9 10 11 12 13 14 15 16 17 18 19 20 21 22 23 24 25 26 27 28 29 30 31 32 33 34 35 36 37 38 39 40 41 42 43 44 45 46 47 48 49 |
using System.Windows.Forms; using ScottPlot; using ScottPlot.Plottable; namespace TestProject { /// <summary> /// 메인 폼 /// </summary> public partial class MainForm : Form { //////////////////////////////////////////////////////////////////////////////////////////////////// Constructor ////////////////////////////////////////////////////////////////////////////////////////// Public #region 생성자 - MainForm() /// <summary> /// 생성자 /// </summary> public MainForm() { InitializeComponent(); Plot plot = new Plot(800, 600); double[] valueArray = DataGen.RandomWalk(100); SignalPlot signalPlot = plot.AddSignal(valueArray); signalPlot.XAxisIndex = 1; plot.XAxis.Grid(false); plot.XAxis.Ticks(false); plot.XAxis2.Grid(true); plot.XAxis2.Ticks(true); plot.XAxis2.Label("Sample Number"); plot.YAxis.Label("Value"); this.formsPlot.Reset(plot); this.formsPlot.Refresh(); } #endregion } } |
TestProject.zip
■ 오른쪽 Y축을 사용하는 방법을 보여준다. ▶ MainForm.cs
1 2 3 4 5 6 7 8 9 10 11 12 13 14 15 16 17 18 19 20 21 22 23 24 25 26 27 28 29 30 31 32 33 34 35 36 37 38 39 40 41 42 43 44 45 46 47 48 49 |
using System.Windows.Forms; using ScottPlot; using ScottPlot.Plottable; namespace TestProject { /// <summary> /// 메인 폼 /// </summary> public partial class MainForm : Form { //////////////////////////////////////////////////////////////////////////////////////////////////// Constructor ////////////////////////////////////////////////////////////////////////////////////////// Public #region 생성자 - MainForm() /// <summary> /// 생성자 /// </summary> public MainForm() { InitializeComponent(); Plot plot = new Plot(800, 600); double[] valueArray = DataGen.RandomWalk(100); SignalPlot signalPlot = plot.AddSignal(valueArray); signalPlot.YAxisIndex = 1; plot.XAxis.Label("샘플 번호"); plot.YAxis.Grid(false); plot.YAxis.Ticks(false); plot.YAxis2.Grid(true); plot.YAxis2.Ticks(true); plot.YAxis2.Label("값"); this.formsPlot.Reset(plot); this.formsPlot.Refresh(); } #endregion } } |
TestProject.zip
■ Plot 클래스의 AddAxis 메소드를 사용해 추가 Y축을 추가하는 방법을 보여준다. ▶ MainForm.cs
1 2 3 4 5 6 7 8 9 10 11 12 13 14 15 16 17 18 19 20 21 22 23 24 25 26 27 28 29 30 31 32 33 34 35 36 37 38 39 40 41 42 43 44 45 46 47 48 49 50 51 52 53 |
using System.Windows.Forms; using ScottPlot; using ScottPlot.Plottable; using ScottPlot.Renderable; namespace TestProject { /// <summary> /// 메인 폼 /// </summary> public partial class MainForm : Form { //////////////////////////////////////////////////////////////////////////////////////////////////// Constructor ////////////////////////////////////////////////////////////////////////////////////////// Public #region 생성자 - MainForm() /// <summary> /// 생성자 /// </summary> public MainForm() { InitializeComponent(); Plot plot = new Plot(800, 600); SignalPlot signalPlot1 = plot.AddSignal(DataGen.Sin(51, mult : 1)); signalPlot1.YAxisIndex = 0; plot.YAxis.Label("Y축"); plot.YAxis.Color(signalPlot1.Color); SignalPlot signalPlot2 = plot.AddSignal(DataGen.Cos(51, mult : 100)); signalPlot2.YAxisIndex = 2; Axis addinalYAxis = plot.AddAxis(Edge.Left, axisIndex: 2); addinalYAxis.Label("추가 Y축"); addinalYAxis.Color(signalPlot2.Color); this.formsPlot.Reset(plot); this.formsPlot.Refresh(); } #endregion } } |
TestProject.zip
■ 기본 축을 사용하는 방법을 보여준다. ▶ MainForm.cs
1 2 3 4 5 6 7 8 9 10 11 12 13 14 15 16 17 18 19 20 21 22 23 24 25 26 27 28 29 30 31 32 33 34 35 36 37 38 39 40 41 42 43 44 45 46 47 48 49 50 51 52 53 54 55 56 57 58 59 60 |
using System.Windows.Forms; using ScottPlot; using ScottPlot.Plottable; namespace TestProject { /// <summary> /// 메인 폼 /// </summary> public partial class MainForm : Form { //////////////////////////////////////////////////////////////////////////////////////////////////// Constructor ////////////////////////////////////////////////////////////////////////////////////////// Public #region 생성자 - MainForm() /// <summary> /// 생성자 /// </summary> public MainForm() { InitializeComponent(); Plot plot = new Plot(800, 600); SignalPlot signalPlot1 = plot.AddSignal(DataGen.Sin(51, mult : 1), sampleRate : 1); signalPlot1.YAxisIndex = 0; signalPlot1.XAxisIndex = 0; SignalPlot signalPlot2 = plot.AddSignal(DataGen.Cos(51, mult : 100), sampleRate : 100); signalPlot2.YAxisIndex = 1; signalPlot2.XAxisIndex = 1; plot.XAxis.Label("X축"); plot.XAxis.Color(signalPlot1.Color); plot.XAxis2.Color(signalPlot2.Color); plot.XAxis2.Ticks(true); plot.XAxis2.Label("보조 X축"); plot.YAxis.Label("Y축"); plot.YAxis.Color(signalPlot1.Color); plot.YAxis2.Color(signalPlot2.Color); plot.YAxis2.Ticks(true); plot.YAxis2.Label("보조 Y축"); this.formsPlot.Reset(plot); this.formsPlot.Refresh(); } #endregion } } |
TestProject.zip
■ Axis 클래스의 DateTimeFormat 메소드를 사용해 날짜/시간 값을 사용하는 방법을 보여준다. ▶ MainForm.cs
1 2 3 4 5 6 7 8 9 10 11 12 13 14 15 16 17 18 19 20 21 22 23 24 25 26 27 28 29 30 31 32 33 34 35 36 37 38 39 40 41 42 43 44 45 46 47 48 49 50 51 |
using System; using System.Linq; using System.Windows.Forms; using ScottPlot; namespace TestProject { /// <summary> /// 메인 폼 /// </summary> public partial class MainForm : Form { //////////////////////////////////////////////////////////////////////////////////////////////////// Constructor ////////////////////////////////////////////////////////////////////////////////////////// Public #region 생성자 - MainForm() /// <summary> /// 생성자 /// </summary> public MainForm() { InitializeComponent(); Plot plot = new Plot(800, 600); DateTime[] dateTimeArray = new DateTime[100]; for(int i = 0; i < dateTimeArray.Length; i++) { dateTimeArray[i] = new DateTime(1985, 9, 24).AddDays(7 * i); } double[] xValueArray = dateTimeArray.Select(x => x.ToOADate()).ToArray(); double[] yValueArray = DataGen.RandomWalk(dateTimeArray.Length); plot.AddScatter(xValueArray, yValueArray); plot.XAxis.DateTimeFormat(true); this.formsPlot.Reset(plot); this.formsPlot.Refresh(); } #endregion } } |
TestProject.zip
■ Axis 클래스의 TickLabelStyle 메소드를 사용해 눈금을 회전하는 방법을 보여준다. ▶ MainForm.cs
1 2 3 4 5 6 7 8 9 10 11 12 13 14 15 16 17 18 19 20 21 22 23 24 25 26 27 28 29 30 31 32 33 34 35 36 37 38 39 40 41 42 43 |
using System.Windows.Forms; using ScottPlot; namespace TestProject { /// <summary> /// 메인 폼 /// </summary> public partial class MainForm : Form { //////////////////////////////////////////////////////////////////////////////////////////////////// Constructor ////////////////////////////////////////////////////////////////////////////////////////// Public #region 생성자 - MainForm() /// <summary> /// 생성자 /// </summary> public MainForm() { InitializeComponent(); Plot plot = new Plot(800, 600); plot.AddSignal(DataGen.Sin(51)); plot.AddSignal(DataGen.Cos(51)); plot.XAxis.Label("X축"); plot.YAxis.Label("Y축"); plot.XAxis.TickLabelStyle(rotation : 90); this.formsPlot.Reset(plot); this.formsPlot.Refresh(); } #endregion } } |
TestProject.zip
■ Y축만을 표시하는 방법을 보여준다. ▶ MainForm.cs
1 2 3 4 5 6 7 8 9 10 11 12 13 14 15 16 17 18 19 20 21 22 23 24 25 26 27 28 29 30 31 32 33 34 35 36 37 38 39 40 41 42 43 |
using System.Windows.Forms; using ScottPlot; namespace TestProject { /// <summary> /// 메인 폼 /// </summary> public partial class MainForm : Form { //////////////////////////////////////////////////////////////////////////////////////////////////// Constructor ////////////////////////////////////////////////////////////////////////////////////////// Public #region 생성자 - MainForm() /// <summary> /// 생성자 /// </summary> public MainForm() { InitializeComponent(); Plot plot = new Plot(800, 600); plot.AddSignal(DataGen.Sin(51)); plot.AddSignal(DataGen.Cos(51)); plot.XAxis.Ticks(false); plot.XAxis.Line(false); plot.XAxis2.Line(false); plot.YAxis2.Line(false); this.formsPlot.Reset(plot); this.formsPlot.Refresh(); } #endregion } } |
TestProject.zip
■ Axis 클래스의 Grid 메소드를 사용해 축 그리드 스타일을 설정하는 방법을 보여준다. ▶ MainForm.cs
1 2 3 4 5 6 7 8 9 10 11 12 13 14 15 16 17 18 19 20 21 22 23 24 25 26 27 28 29 30 31 32 33 34 35 36 37 38 39 40 41 42 |
using System.Drawing; using System.Windows.Forms; using ScottPlot; namespace TestProject { /// <summary> /// 메인 폼 /// </summary> public partial class MainForm : Form { //////////////////////////////////////////////////////////////////////////////////////////////////// Constructor ////////////////////////////////////////////////////////////////////////////////////////// Public #region 생성자 - MainForm() /// <summary> /// 생성자 /// </summary> public MainForm() { InitializeComponent(); Plot plot = new Plot(800, 600); plot.AddSignal(DataGen.Sin(51)); plot.AddSignal(DataGen.Cos(51)); plot.Grid(color : Color.FromArgb(50, Color.Green)); plot.Grid(lineStyle : LineStyle.Dot); this.formsPlot.Reset(plot); this.formsPlot.Refresh(); } #endregion } } |
TestProject.zip
■ Axis 클래스의 Grid 메소드를 사용해 축 그리드를 비활성화하는 방법을 보여준다. ▶ MainForm.cs
1 2 3 4 5 6 7 8 9 10 11 12 13 14 15 16 17 18 19 20 21 22 23 24 25 26 27 28 29 30 31 32 33 34 35 36 37 38 39 40 |
using System.Windows.Forms; using ScottPlot; namespace TestProject { /// <summary> /// 메인 폼 /// </summary> public partial class MainForm : Form { //////////////////////////////////////////////////////////////////////////////////////////////////// Constructor ////////////////////////////////////////////////////////////////////////////////////////// Public #region 생성자 - MainForm() /// <summary> /// 생성자 /// </summary> public MainForm() { InitializeComponent(); Plot plot = new Plot(800, 600); plot.AddSignal(DataGen.Sin(51)); plot.AddSignal(DataGen.Cos(51)); plot.XAxis.Grid(false); this.formsPlot.Reset(plot); this.formsPlot.Refresh(); } #endregion } } |
TestProject.zip
■ Plot 클래스의 Grid 메소드를 사용해 그리드를 비활성화하는 방법을 보여준다. ▶ MainForm.cs
1 2 3 4 5 6 7 8 9 10 11 12 13 14 15 16 17 18 19 20 21 22 23 24 25 26 27 28 29 30 31 32 33 34 35 36 37 38 39 40 |
using System.Windows.Forms; using ScottPlot; namespace TestProject { /// <summary> /// 메인 폼 /// </summary> public partial class MainForm : Form { //////////////////////////////////////////////////////////////////////////////////////////////////// Constructor ////////////////////////////////////////////////////////////////////////////////////////// Public #region 생성자 - MainForm() /// <summary> /// 생성자 /// </summary> public MainForm() { InitializeComponent(); Plot plot = new Plot(800, 600); plot.AddSignal(DataGen.Sin(51)); plot.AddSignal(DataGen.Cos(51)); plot.Grid(false); this.formsPlot.Reset(plot); this.formsPlot.Refresh(); } #endregion } } |
TestProject.zip
■ 축을 커스텀 정의하는 방법을 보여준다. ▶ MainForm.cs
1 2 3 4 5 6 7 8 9 10 11 12 13 14 15 16 17 18 19 20 21 22 23 24 25 26 27 28 29 30 31 32 33 34 35 36 37 38 39 40 41 42 43 44 45 46 47 |
using System.Drawing; using System.Windows.Forms; using ScottPlot; namespace TestProject { /// <summary> /// 메인 폼 /// </summary> public partial class MainForm : Form { //////////////////////////////////////////////////////////////////////////////////////////////////// Constructor ////////////////////////////////////////////////////////////////////////////////////////// Public #region 생성자 - MainForm() /// <summary> /// 생성자 /// </summary> public MainForm() { InitializeComponent(); Plot plot = new Plot(800, 600); plot.AddSignal(DataGen.Sin(51)); plot.AddSignal(DataGen.Cos(51)); plot.Title("축 사용자 정의"); plot.XLabel("X축"); plot.XAxis.Color(Color.Green); plot.YLabel("Y축"); plot.YAxis.Label("Y축", Color.Magenta, size : 24, fontName : "나눔고딕코딩"); this.formsPlot.Reset(plot); this.formsPlot.Refresh(); } #endregion } } |
TestProject.zip
■ Plot 클래스의 XLabel/YLabel 메소드를 사용해 축 명칭을 설정하는 방법을 보여준다. ▶ 예제 코드 (C#)
|
|
using ScottPlot; Plot plot = new Plot(800, 600); plot.XLabel("X축"); plot.YLabel("Y축"); |
■ Axis 클래스의 TickMarkDirection 메소드를 사용해 눈금 표시 방향을 반전하는 방법을 보여준다. ▶ MainForm.cs
1 2 3 4 5 6 7 8 9 10 11 12 13 14 15 16 17 18 19 20 21 22 23 24 25 26 27 28 29 30 31 32 33 34 35 36 37 38 39 40 41 |
using System.Windows.Forms; using ScottPlot; namespace TestProject { /// <summary> /// 메인 폼 /// </summary> public partial class MainForm : Form { //////////////////////////////////////////////////////////////////////////////////////////////////// Constructor ////////////////////////////////////////////////////////////////////////////////////////// Public #region 생성자 - MainForm() /// <summary> /// 생성자 /// </summary> public MainForm() { InitializeComponent(); Plot plot = new Plot(800, 600); plot.AddSignal(DataGen.Sin(51)); plot.AddSignal(DataGen.Cos(51)); plot.XAxis.TickMarkDirection(outward : false); plot.YAxis.TickMarkDirection(outward : false); this.formsPlot.Reset(plot); this.formsPlot.Refresh(); } #endregion } } |
TestProject.zip
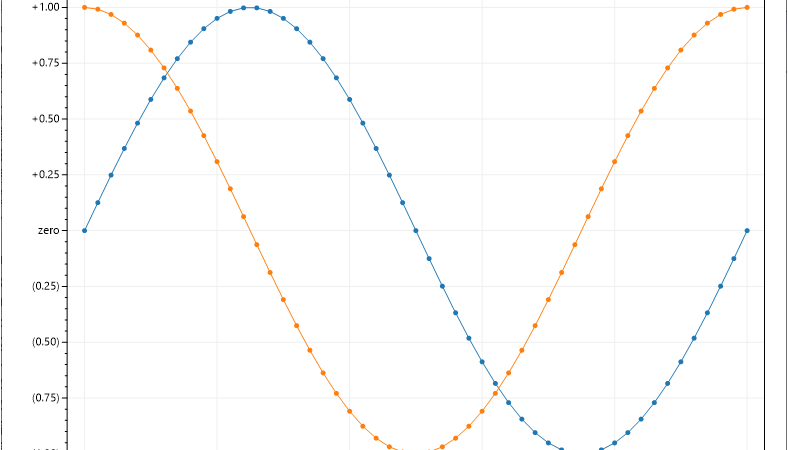
■ Axis 클래스의 TickLabelFormat 메소드를 사용해 커스텀 눈금을 설정하는 방법을 보여준다. ▶ MainForm.cs
1 2 3 4 5 6 7 8 9 10 11 12 13 14 15 16 17 18 19 20 21 22 23 24 25 26 27 28 29 30 31 32 33 34 35 36 37 38 39 40 41 42 43 44 45 46 47 48 49 50 51 52 53 54 55 56 57 58 |
using System; using System.Windows.Forms; using ScottPlot; namespace TestProject { /// <summary> /// 메인 폼 /// </summary> public partial class MainForm : Form { //////////////////////////////////////////////////////////////////////////////////////////////////// Constructor ////////////////////////////////////////////////////////////////////////////////////////// Public #region 생성자 - MainForm() /// <summary> /// 생성자 /// </summary> public MainForm() { InitializeComponent(); Plot plot = new Plot(800, 600); plot.AddSignal(DataGen.Sin(51)); plot.AddSignal(DataGen.Cos(51)); Func<double, string> tickLabelFormatFunction = (position) => { if(position == 0) { return "zero"; } else if(position > 0) { return $"+{position:F2}"; } else { return $"({Math.Abs(position):F2})"; } }; plot.XAxis.TickLabelFormat(tickLabelFormatFunction); plot.YAxis.TickLabelFormat(tickLabelFormatFunction); this.formsPlot.Reset(plot); this.formsPlot.Refresh(); } #endregion } } |
TestProject.zip
■ Axis 클래스의 MinimumTickSpacing 메소드를 사용해 최소 눈금 간격을 설정하는 방법을 보여준다. ▶ MainForm.cs
1 2 3 4 5 6 7 8 9 10 11 12 13 14 15 16 17 18 19 20 21 22 23 24 25 26 27 28 29 30 31 32 33 34 35 36 37 38 39 40 41 |
using System.Windows.Forms; using ScottPlot; namespace TestProject { /// <summary> /// 메인 폼 /// </summary> public partial class MainForm : Form { //////////////////////////////////////////////////////////////////////////////////////////////////// Constructor ////////////////////////////////////////////////////////////////////////////////////////// Public #region 생성자 - MainForm() /// <summary> /// 생성자 /// </summary> public MainForm() { InitializeComponent(); Plot plot = new Plot(800, 600); plot.AddSignal(DataGen.Sin(51)); plot.AddSignal(DataGen.Cos(51)); plot.YAxis.MinimumTickSpacing(1); plot.XAxis.MinimumTickSpacing(25); this.formsPlot.Reset(plot); this.formsPlot.Refresh(); } #endregion } } |
TestProject.zip
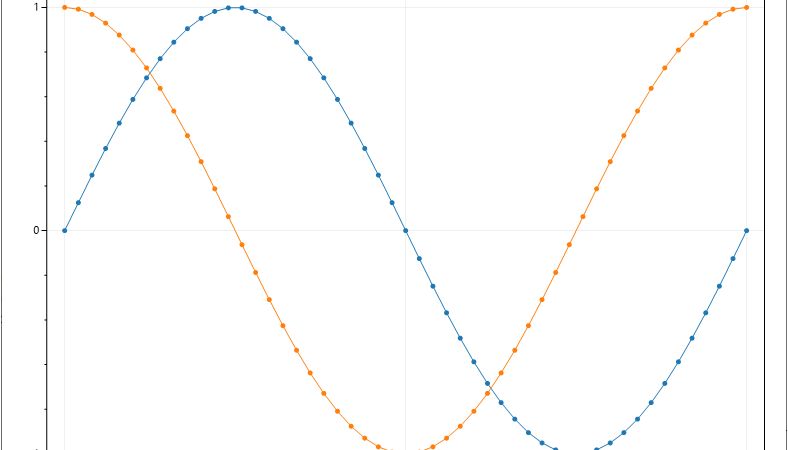
■ Axis 클래스의 TickDensity 메소드를 사용해 눈금 밀도를 설정하는 방법을 보여준다. ▶ MainForm.cs
1 2 3 4 5 6 7 8 9 10 11 12 13 14 15 16 17 18 19 20 21 22 23 24 25 26 27 28 29 30 31 32 33 34 35 36 37 38 39 40 41 42 43 44 |
using System.Windows.Forms; using ScottPlot; namespace TestProject { /// <summary> /// 메인 폼 /// </summary> public partial class MainForm : Form { //////////////////////////////////////////////////////////////////////////////////////////////////// Constructor ////////////////////////////////////////////////////////////////////////////////////////// Public #region 생성자 - MainForm() /// <summary> /// 생성자 /// </summary> public MainForm() { InitializeComponent(); Plot plot = new Plot(800, 600); plot.AddSignal(DataGen.Sin(51)); plot.AddSignal(DataGen.Cos(51)); plot.XAxis.Label("저밀도 눈금"); plot.XAxis.TickDensity(0.2); plot.YAxis.Label("고밀도 눈금"); plot.YAxis.TickDensity(3); this.formsPlot.Reset(plot); this.formsPlot.Refresh(); } #endregion } } |
TestProject.zip
■ Axis 클래스의 ImageLabel 메소드를 사용해 이미지를 축 레이블로 설정하는 방법을 보여준다. ▶ MainForm.cs
1 2 3 4 5 6 7 8 9 10 11 12 13 14 15 16 17 18 19 20 21 22 23 24 25 26 27 28 29 30 31 32 33 34 35 36 37 38 39 40 41 42 43 44 45 46 47 48 49 50 51 52 53 54 55 56 57 |
using System; using System.Drawing; using System.Windows.Forms; using ScottPlot; using ScottPlot.Drawing; using ScottPlot.Statistics; namespace TestProject { /// <summary> /// 메인 폼 /// </summary> public partial class MainForm : Form { //////////////////////////////////////////////////////////////////////////////////////////////////// Constructor ////////////////////////////////////////////////////////////////////////////////////////// Public #region 생성자 - MainForm() /// <summary> /// 생성자 /// </summary> public MainForm() { InitializeComponent(); Plot plot = new Plot(800, 600); double[] xValueArray = DataGen.Range(-5, 5, .5); double[] yValueArray = DataGen.Range(-5, 5, .5); Vector2[,] vectorArray = new Vector2[xValueArray.Length, yValueArray.Length]; for(int i = 0; i < xValueArray.Length; i++) { for(int j = 0; j < yValueArray.Length; j++) { vectorArray[i, j] = new Vector2(yValueArray[j], -15 * Math.Sin(xValueArray[i])); } } plot.AddVectorField(vectorArray, xValueArray, yValueArray, colormap : Colormap.Turbo); plot.XAxis.ImageLabel(new Bitmap("IMAGE/theta.png")); plot.YAxis.ImageLabel(new Bitmap("IMAGE/d_theta_dt.png")); this.formsPlot.Reset(plot); this.formsPlot.Refresh(); } #endregion } } |
TestProject.zip
■ Axis 클래스의 RulerMode 메소드를 사용해 눈금자 모드를 설정하는 방법을 보여준다. ▶ MainForm.cs
1 2 3 4 5 6 7 8 9 10 11 12 13 14 15 16 17 18 19 20 21 22 23 24 25 26 27 28 29 30 31 32 33 34 35 36 37 38 39 40 41 |
using System.Windows.Forms; using ScottPlot; namespace TestProject { /// <summary> /// 메인 폼 /// </summary> public partial class MainForm : Form { //////////////////////////////////////////////////////////////////////////////////////////////////// Constructor ////////////////////////////////////////////////////////////////////////////////////////// Public #region 생성자 - MainForm() /// <summary> /// 생성자 /// </summary> public MainForm() { InitializeComponent(); Plot plot = new Plot(800, 600); plot.AddSignal(DataGen.Sin(51)); plot.AddSignal(DataGen.Cos(51)); plot.XAxis.RulerMode(true); plot.YAxis.RulerMode(true); this.formsPlot.Reset(plot); this.formsPlot.Refresh(); } #endregion } } |
TestProject.zip
■ 로그 스케일 눈금 밀도를 설정하는 방법을 보여준다. ▶ MainForm.cs
1 2 3 4 5 6 7 8 9 10 11 12 13 14 15 16 17 18 19 20 21 22 23 24 25 26 27 28 29 30 31 32 33 34 35 36 37 38 39 40 41 42 43 44 45 46 47 48 49 50 |
using System; using System.Drawing; using System.Linq; using System.Windows.Forms; using ScottPlot; namespace TestProject { /// <summary> /// 메인 폼 /// </summary> public partial class MainForm : Form { //////////////////////////////////////////////////////////////////////////////////////////////////// Constructor ////////////////////////////////////////////////////////////////////////////////////////// Public #region 생성자 - MainForm() /// <summary> /// 생성자 /// </summary> public MainForm() { InitializeComponent(); Plot plot = new Plot(800, 600); double[] yValueArray = DataGen.Range(100, 10000, 100, true); double[] xValueArray = DataGen.Consecutive(yValueArray.Length); double[] logYValueArray = yValueArray.Select(y => Math.Log10(y)).ToArray(); plot.AddScatter(xValueArray, logYValueArray); plot.XAxis.MajorGrid(true, Color.FromArgb(80, Color.Black)); plot.YAxis.MajorGrid(true, Color.FromArgb(80, Color.Black)); plot.YAxis.MinorGrid(true, Color.FromArgb(20, Color.Black)); plot.YAxis.MinorLogScale(true, minorTickCount : 20); plot.YAxis.TickLabelFormat((y) => Math.Pow(10, y).ToString("N0")); this.formsPlot.Reset(plot); this.formsPlot.Refresh(); } #endregion } } |
TestProject.zip
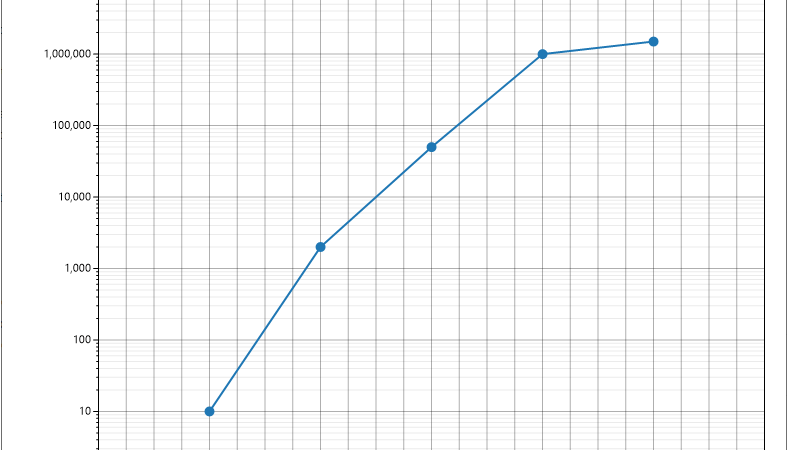
■ 로그 스케일을 사용하는 방법을 보여준다. ▶ MainForm.cs
1 2 3 4 5 6 7 8 9 10 11 12 13 14 15 16 17 18 19 20 21 22 23 24 25 26 27 28 29 30 31 32 33 34 35 36 37 38 39 40 41 42 43 44 45 46 47 48 49 50 51 52 53 54 |
using System; using System.Drawing; using System.Linq; using System.Windows.Forms; using ScottPlot; using ScottPlot.Plottable; namespace TestProject { /// <summary> /// 메인 폼 /// </summary> public partial class MainForm : Form { //////////////////////////////////////////////////////////////////////////////////////////////////// Constructor ////////////////////////////////////////////////////////////////////////////////////////// Public #region 생성자 - MainForm() /// <summary> /// 생성자 /// </summary> public MainForm() { InitializeComponent(); Plot plot = new Plot(800, 600); double[] xValueArray = { 1 , 2 , 3 , 4 , 5 }; double[] yValueArray = { 10, 2000, 50000, 1000000, 1500000 }; double[] logYValueArray = yValueArray.Select(y => Math.Log10(y)).ToArray(); ScatterPlot scatterPlot = plot.AddScatter(xValueArray, logYValueArray, lineWidth : 2, markerSize : 10); plot.XAxis.MajorGrid(true, Color.FromArgb(80, Color.Black)); plot.YAxis.MajorGrid(true, Color.FromArgb(80, Color.Black)); plot.YAxis.MinorGrid(true, Color.FromArgb(20, Color.Black)); plot.YAxis.MinorLogScale(true); plot.YAxis.TickLabelFormat((double y) => Math.Pow(10, y).ToString("N0")); plot.SetAxisLimits(0, 6, 0, Math.Log10(10000000)); this.formsPlot.Reset(plot); this.formsPlot.Refresh(); } #endregion } } |
TestProject.zip
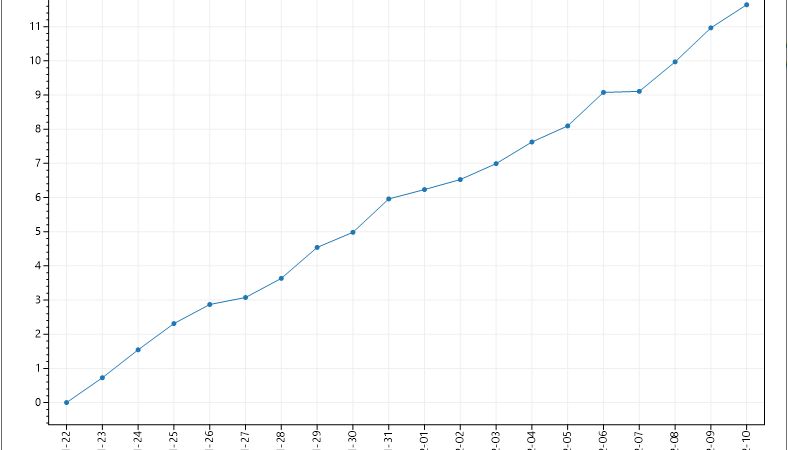
■ 날짜/시간 축에 대해 고정 눈금 간격을 사용하는 방법을 보여준다. ▶ MainForm.cs
1 2 3 4 5 6 7 8 9 10 11 12 13 14 15 16 17 18 19 20 21 22 23 24 25 26 27 28 29 30 31 32 33 34 35 36 37 38 39 40 41 42 43 44 45 46 47 48 49 50 51 52 53 54 55 56 57 58 59 60 61 62 63 64 65 66 |
using System; using System.Windows.Forms; using ScottPlot; namespace TestProject { /// <summary> /// 메인 폼 /// </summary> public partial class MainForm : Form { //////////////////////////////////////////////////////////////////////////////////////////////////// Constructor ////////////////////////////////////////////////////////////////////////////////////////// Public #region 생성자 - MainForm() /// <summary> /// 생성자 /// </summary> public MainForm() { InitializeComponent(); Plot plot = new Plot(800, 600); int pointCount = 20; double[] dateArray = new double[pointCount]; DateTime startDate = new DateTime(2020, 1, 22); for(int i = 0; i < pointCount; i++) { dateArray[i] = startDate.AddDays(i).ToOADate(); } double[] valueArray = new double[pointCount]; Random random = new Random(0); for(int i = 1; i < pointCount; i++) { valueArray[i] = valueArray[i - 1] + random.NextDouble(); } plot.AddScatter(dateArray, valueArray); plot.XAxis.DateTimeFormat(true); plot.XAxis.ManualTickSpacing(1, ScottPlot.Ticks.DateTimeUnit.Day); plot.XAxis.TickLabelStyle(rotation : 90); plot.XAxis.SetSizeLimit(min : 50); this.formsPlot.Reset(plot); this.formsPlot.Refresh(); } #endregion } } |
TestProject.zip
■ Axis 클래스의 TickLabelNotation 메소드를 사용해 오프셋 표기법(Offset Notation)을 설정하는 방법을 보여준다. ▶ MainForm.cs
1 2 3 4 5 6 7 8 9 10 11 12 13 14 15 16 17 18 19 20 21 22 23 24 25 26 27 28 29 30 31 32 33 34 35 36 37 38 39 40 |
using System.Windows.Forms; using ScottPlot; namespace TestProject { /// <summary> /// 메인 폼 /// </summary> public partial class MainForm : Form { //////////////////////////////////////////////////////////////////////////////////////////////////// Constructor ////////////////////////////////////////////////////////////////////////////////////////// Public #region 생성자 - MainForm() /// <summary> /// 생성자 /// </summary> public MainForm() { InitializeComponent(); Plot plot = new Plot(800, 600); plot.AddLine(1e5 + 111, 1e10 + 111, 1e5 + 222, 1e10 + 222); plot.XAxis.TickLabelNotation(offset : true); plot.YAxis.TickLabelNotation(offset : true); this.formsPlot.Reset(plot); this.formsPlot.Refresh(); } #endregion } } |
TestProject.zip
■ Axis 클래스의 TickLabelNotation 메소드를 사용해 승수 표기법(Multiplier Notation)을 설정하는 방법을 보여준다. ▶ MainForm.cs
1 2 3 4 5 6 7 8 9 10 11 12 13 14 15 16 17 18 19 20 21 22 23 24 25 26 27 28 29 30 31 32 33 34 35 36 37 38 39 40 |
using System.Windows.Forms; using ScottPlot; namespace TestProject { /// <summary> /// 메인 폼 /// </summary> public partial class MainForm : Form { //////////////////////////////////////////////////////////////////////////////////////////////////// Constructor ////////////////////////////////////////////////////////////////////////////////////////// Public #region 생성자 - MainForm() /// <summary> /// 생성자 /// </summary> public MainForm() { InitializeComponent(); Plot plot = new Plot(800, 600); plot.AddLine(-1e5, -1e10, 1e5, 1e10); plot.XAxis.TickLabelNotation(multiplier : true); plot.YAxis.TickLabelNotation(multiplier : true); this.formsPlot.Reset(plot); this.formsPlot.Refresh(); } #endregion } } |
TestProject.zip
■ Axis 클래스의 TickLabelFormat 메소드를 사용해 커스텀 날짜 눈금을 설정하는 방법을 보여준다. ▶ MainForm.cs
1 2 3 4 5 6 7 8 9 10 11 12 13 14 15 16 17 18 19 20 21 22 23 24 25 26 27 28 29 30 31 32 33 34 35 36 37 38 39 40 41 42 43 44 45 46 47 48 49 50 51 52 |
using System; using System.Windows.Forms; using ScottPlot; namespace TestProject { /// <summary> /// 메인 폼 /// </summary> public partial class MainForm : Form { //////////////////////////////////////////////////////////////////////////////////////////////////// Constructor ////////////////////////////////////////////////////////////////////////////////////////// Public #region 생성자 - MainForm() /// <summary> /// 생성자 /// </summary> public MainForm() { InitializeComponent(); Plot plot = new Plot(800, 600); int pointCount = 10; double[] valueArray = DataGen.RandomWalk(null, pointCount); double[] dayArray = new double[pointCount]; DateTime startDate = new DateTime(1985, 09, 24); for(int i = 0; i < dayArray.Length; i++) { dayArray[i] = startDate.AddDays(1).AddDays(i).ToOADate(); } plot.AddScatter(dayArray, valueArray); plot.XAxis.TickLabelFormat("M\\/dd", dateTimeFormat : true); this.formsPlot.Reset(plot); this.formsPlot.Refresh(); } #endregion } } |
TestProject.zip


