[C#/WINFORM/TEECHART] TChart 클래스 : Import/Export 속성을 사용해 차트간 커스텀 팔레트 적용하기

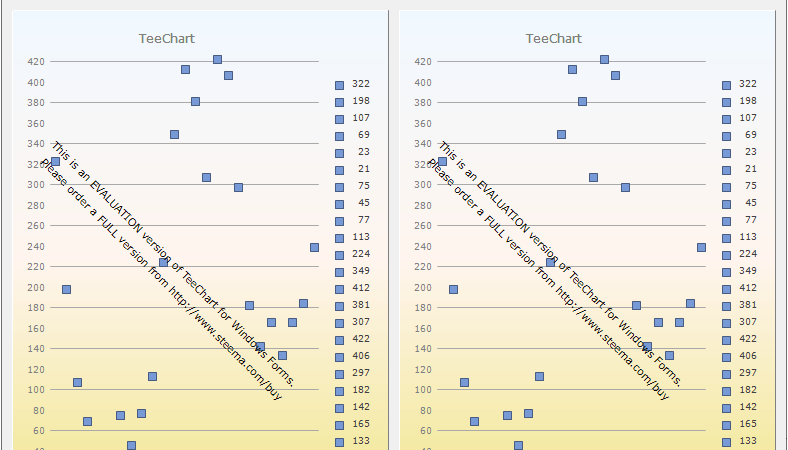
■ TChart 클래스의 Import/Export 속성을 사용해 차트간 커스텀 팔레트를 적용하는 방법을 보여준다. ▶ MainForm.cs
|
1 2 3 4 5 6 7 8 9 10 11 12 13 14 15 16 17 18 19 20 21 22 23 24 25 26 27 28 29 30 31 32 33 34 35 36 37 38 39 40 41 42 43 44 45 46 47 48 49 50 51 52 53 54 55 56 57 58 59 60 61 62 63 64 65 66 67 68 69 70 71 72 73 74 75 76 77 78 79 80 81 82 83 84 85 86 87 88 89 90 91 92 93 94 95 96 97 98 99 100 101 102 103 104 105 106 107 108 109 110 111 112 113 114 115 116 117 118 119 120 121 122 123 124 125 126 127 128 129 130 131 132 133 134 135 136 137 138 139 140 141 142 143 144 145 |
using System; using System.Drawing; using System.IO; using System.Windows.Forms; using Steema.TeeChart; using Steema.TeeChart.Drawing; using Steema.TeeChart.Styles; namespace TestProject { /// <summary> /// 메인 폼 /// </summary> public partial class MainForm : Form { //////////////////////////////////////////////////////////////////////////////////////////////////// Field ////////////////////////////////////////////////////////////////////////////////////////// Private #region Field /// <summary> /// 테마 디렉토리 경로 /// </summary> private string themeDirectoryPath; #endregion //////////////////////////////////////////////////////////////////////////////////////////////////// Constructor ////////////////////////////////////////////////////////////////////////////////////////// Public #region 생성자 - MainForm() /// <summary> /// 생성자 /// </summary> public MainForm() { InitializeComponent(); Text = "TChart 클래스 : Import/Export 속성을 사용해 차트간 커스텀 팔레트 적용하기"; this.saveWithTemplateCheckBox.Checked = true; this.tChart1.Panel.Pen = new ChartPen(Color.Black); SetChartStyle(this.tChart1); Points points = new Points(this.tChart1.Chart); points.FillSampleValues(); this.tChart2.Panel.Pen = new ChartPen(Color.Black); this.applyThemeButton.Click += applyThemeButton_Click; } #endregion //////////////////////////////////////////////////////////////////////////////////////////////////// Method ////////////////////////////////////////////////////////////////////////////////////////// Private //////////////////////////////////////////////////////////////////////////////// Event #region 테마 적용 버튼 클릭시 처리하기 - applyThemeButton_Click(sender, e) /// <summary> /// 테마 적용 버튼 클릭시 처리하기 /// </summary> /// <param name="sender">이벤트 발생자</param> /// <param name="e">이벤트 인자</param> private void applyThemeButton_Click(object sender, EventArgs e) { SaveCustomTheme(); this.tChart2.Clear(); this.tChart2.Import.Theme.Load(Path.Combine(this.themeDirectoryPath, "CustomTheme.xml")); } #endregion //////////////////////////////////////////////////////////////////////////////// Function #region 차트 스타일 설정하기 - SetChartStyle(tChart) /// <summary> /// 차트 스타일 설정하기 /// </summary> /// <param name="tChart">TChart</param> private void SetChartStyle(TChart tChart) { tChart.Aspect.View3D = false; tChart.Panel.Gradient.StartColor = Color.AliceBlue; tChart.Panel.Gradient.MiddleColor = Color.SeaShell; tChart.Panel.Gradient.EndColor = Color.Khaki; tChart.Panel.Gradient.Visible = true; tChart.Panel.Bevel.Inner = BevelStyles.Raised; tChart.Panel.Bevel.Outer = BevelStyles.None; tChart.Header.Font.Name = "Verdana"; tChart.Header.Font.Size = 9; tChart.Legend.Font.Name = "Verdana"; tChart.Legend.Font.Size = 7; for(int i = 0; i < tChart.Axes.Count; ++i) { Axis axis = tChart.Axes[i]; axis.Labels.Font.Name = "Verdana"; axis.Labels.Font.Size = 7; } } #endregion #region 커스텀 테마 저장하기 - SaveCustomTheme() /// <summary> /// 커스텀 테마 저장하기 /// </summary> private void SaveCustomTheme() { this.themeDirectoryPath = Utils.ThemeFolder(); if(!Directory.Exists(this.themeDirectoryPath)) { this.themeDirectoryPath = Environment.GetFolderPath(Environment.SpecialFolder.ApplicationData); } this.tChart1.Export.Theme.SaveWithBase64 = this.saveWithTemplateCheckBox.Checked; if(!Directory.Exists(this.themeDirectoryPath)) { Directory.CreateDirectory(this.themeDirectoryPath); } this.tChart1.Export.Theme.Save(Path.Combine(this.themeDirectoryPath, "CustomTheme.xml")); } #endregion } } |
TestProject.zip


