■ Plot 클래스의 AddScatter 메소드를 사용해 임의 X/Y 포인트를 그리는 방법을 보여준다. ▶ MainForm.cs
1 2 3 4 5 6 7 8 9 10 11 12 13 14 15 16 17 18 19 20 21 22 23 24 25 26 27 28 29 30 31 32 33 34 35 36 37 38 39 40 41 42 43 44 45 46 47 48 49 50 |
using System; using System.Windows.Forms; using ScottPlot; namespace TestProject { /// <summary> /// 메인 폼 /// </summary> public partial class MainForm : Form { //////////////////////////////////////////////////////////////////////////////////////////////////// Constructor ////////////////////////////////////////////////////////////////////////////////////////// Public #region 생성자 - MainForm() /// <summary> /// 생성자 /// </summary> public MainForm() { InitializeComponent(); Plot plot = new Plot(800, 600); Random random = new Random(0); int pointCount = 51; double[] xValueArray1 = DataGen.RandomNormal(random, pointCount, 1); double[] xValueArray2 = DataGen.RandomNormal(random, pointCount, 3); double[] yValueArray1 = DataGen.RandomNormal(random, pointCount, 5); double[] yValueArray2 = DataGen.RandomNormal(random, pointCount, 7); plot.AddScatter(xValueArray1, yValueArray1, markerSize : 0, label : "lines only"); plot.AddScatter(xValueArray2, yValueArray2, lineWidth : 0, label : "markers only"); plot.Legend(); this.formsPlot.Reset(plot); this.formsPlot.Refresh(); } #endregion } } |
TestProject.zip
■ Plot 클래스의 AddScatter 메소드를 사용해 커스텀 선을 그리는 방법을 보여준다. ▶ MainForm.cs
1 2 3 4 5 6 7 8 9 10 11 12 13 14 15 16 17 18 19 20 21 22 23 24 25 26 27 28 29 30 31 32 33 34 35 36 37 38 39 40 41 42 43 44 45 46 47 48 49 50 51 52 |
using System.Drawing; using System.Windows.Forms; using ScottPlot; using ScottPlot.Renderable; namespace TestProject { /// <summary> /// 메인 폼 /// </summary> public partial class MainForm : Form { //////////////////////////////////////////////////////////////////////////////////////////////////// Constructor ////////////////////////////////////////////////////////////////////////////////////////// Public #region 생성자 - MainForm() /// <summary> /// 생성자 /// </summary> public MainForm() { InitializeComponent(); Plot plot = new Plot(800, 600); int pointCount = 51; double[] xValueArray = DataGen.Consecutive(pointCount); double[] yValueArray1 = DataGen.Sin(pointCount); double[] yValueArray2 = DataGen.Cos(pointCount); double[] yValueArray3 = DataGen.Cos(pointCount, mult : -1); plot.AddScatter(xValueArray, yValueArray1, color : Color.Magenta, lineWidth : 0, markerSize : 10); plot.AddScatter(xValueArray, yValueArray2, color : Color.Green , lineWidth : 5, markerSize : 0); plot.AddScatter(xValueArray, yValueArray3, color : Color.Blue , lineWidth : 3, markerSize : 0, lineStyle : LineStyle.DashDot); Legend legend = plot.Legend(); legend.FixedLineWidth = false; this.formsPlot.Reset(plot); this.formsPlot.Refresh(); } #endregion } } |
TestProject.zip
■ Plot 클래스의 AddScatter 메소드를 사용해 모든 마커 도형을 그리는 방법을 보여준다. ▶ MainForm.cs
1 2 3 4 5 6 7 8 9 10 11 12 13 14 15 16 17 18 19 20 21 22 23 24 25 26 27 28 29 30 31 32 33 34 35 36 37 38 39 40 41 42 43 44 45 46 47 48 49 50 51 52 53 54 55 56 57 58 59 60 61 62 63 64 65 |
using System; using System.Windows.Forms; using ScottPlot; using ScottPlot.Renderable; namespace TestProject { /// <summary> /// 메인 폼 /// </summary> public partial class MainForm : Form { //////////////////////////////////////////////////////////////////////////////////////////////////// Constructor ////////////////////////////////////////////////////////////////////////////////////////// Public #region 생성자 - MainForm() /// <summary> /// 생성자 /// </summary> public MainForm() { InitializeComponent(); Plot plot = new Plot(800, 600); int pointCount = 51; double[] xValueArray = DataGen.Consecutive(pointCount); string[] markerShapeNameArray = Enum.GetNames(typeof(MarkerShape)); for(int i = 0; i < markerShapeNameArray.Length; i++) { Enum.TryParse(markerShapeNameArray[i], out MarkerShape markerShape); double[] yValueArray = DataGen.Sin(pointCount, 2, -i); plot.AddScatter ( xValueArray, yValueArray, markerSize : 7, markerShape : markerShape, label : markerShapeNameArray[i] ); } plot.Grid(enable: false); Legend legend = plot.Legend(); legend.FontSize = 10; this.formsPlot.Reset(plot); this.formsPlot.Refresh(); } #endregion } } |
TestProject.zip
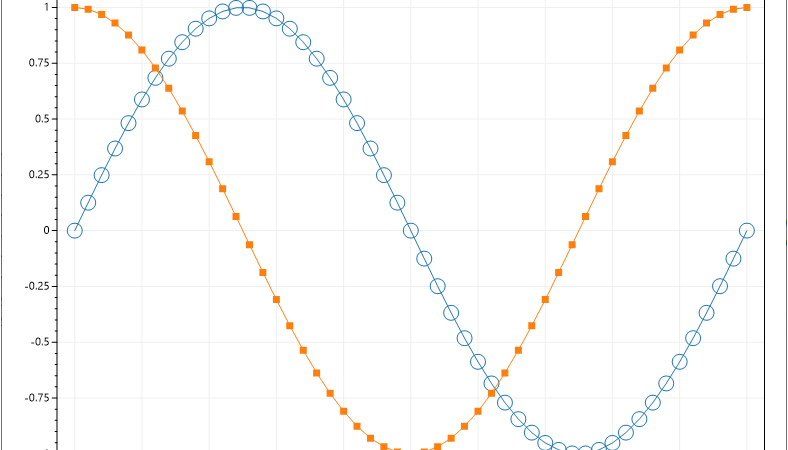
■ ScatterPlot 클래스의 MarkerShape 속성을 사용해 커스텀 마커를 설정하는 방법을 보여준다. ▶ MainForm.cs
1 2 3 4 5 6 7 8 9 10 11 12 13 14 15 16 17 18 19 20 21 22 23 24 25 26 27 28 29 30 31 32 33 34 35 36 37 38 39 40 41 42 43 44 45 46 47 48 49 50 |
using System.Windows.Forms; using ScottPlot; using ScottPlot.Plottable; namespace TestProject { /// <summary> /// 메인 폼 /// </summary> public partial class MainForm : Form { //////////////////////////////////////////////////////////////////////////////////////////////////// Constructor ////////////////////////////////////////////////////////////////////////////////////////// Public #region 생성자 - MainForm() /// <summary> /// 생성자 /// </summary> public MainForm() { InitializeComponent(); Plot plot = new Plot(800, 600); int pointCount = 51; double[] xValueArray = DataGen.Consecutive(pointCount); double[] yValueArray1 = DataGen.Sin(pointCount); double[] yValueArray2 = DataGen.Cos(pointCount); ScatterPlot scatterPlot1 = plot.AddScatter(xValueArray, yValueArray1, markerSize : 15); scatterPlot1.MarkerShape = MarkerShape.openCircle; ScatterPlot scatterPlot2 = plot.AddScatter(xValueArray, yValueArray2, markerSize : 7); scatterPlot2.MarkerShape = MarkerShape.filledSquare; this.formsPlot.Reset(plot); this.formsPlot.Refresh(); } #endregion } } |
TestProject.zip
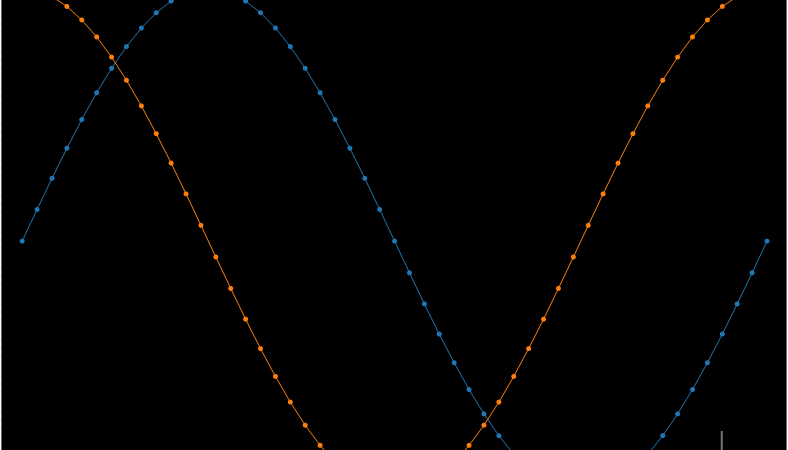
■ 스타일 적용 스케일 바를 사용하는 방법을 보여준다. ▶ MainForm.cs
1 2 3 4 5 6 7 8 9 10 11 12 13 14 15 16 17 18 19 20 21 22 23 24 25 26 27 28 29 30 31 32 33 34 35 36 37 38 39 40 41 42 43 44 45 |
using System.Windows.Forms; using ScottPlot; namespace TestProject { /// <summary> /// 메인 폼 /// </summary> public partial class MainForm : Form { //////////////////////////////////////////////////////////////////////////////////////////////////// Constructor ////////////////////////////////////////////////////////////////////////////////////////// Public #region 생성자 - MainForm() /// <summary> /// 생성자 /// </summary> public MainForm() { InitializeComponent(); Plot plot = new Plot(800, 600); plot.AddSignal(DataGen.Sin(51)); plot.AddSignal(DataGen.Cos(51)); plot.Frameless(); plot.Grid(enable : false); plot.AddScaleBar(5, .25, "100 ms", "250 mV"); plot.Style(Style.Black); this.formsPlot.Reset(plot); this.formsPlot.Refresh(); } #endregion } } |
TestProject.zip
■ Plot 클래스의 AddScaleBar 메소드를 사용해 수평 스케일 바를 표시하는 방법을 보여준다. ▶ MainForm.cs
1 2 3 4 5 6 7 8 9 10 11 12 13 14 15 16 17 18 19 20 21 22 23 24 25 26 27 28 29 30 31 32 33 34 35 36 37 38 39 40 41 42 43 44 45 |
using System.Windows.Forms; using ScottPlot; namespace TestProject { /// <summary> /// 메인 폼 /// </summary> public partial class MainForm : Form { //////////////////////////////////////////////////////////////////////////////////////////////////// Constructor ////////////////////////////////////////////////////////////////////////////////////////// Public #region 생성자 - MainForm() /// <summary> /// 생성자 /// </summary> public MainForm() { InitializeComponent(); Plot plot = new Plot(800, 600); plot.AddSignal(DataGen.Sin(51)); plot.AddSignal(DataGen.Cos(51)); plot.Grid(enable : false); plot.XAxis.Hide(); plot.XAxis2.Hide(); plot.YAxis2.Hide(); plot.AddScaleBar(5, 0, "100 ms", null); this.formsPlot.Reset(plot); this.formsPlot.Refresh(); } #endregion } } |
TestProject.zip
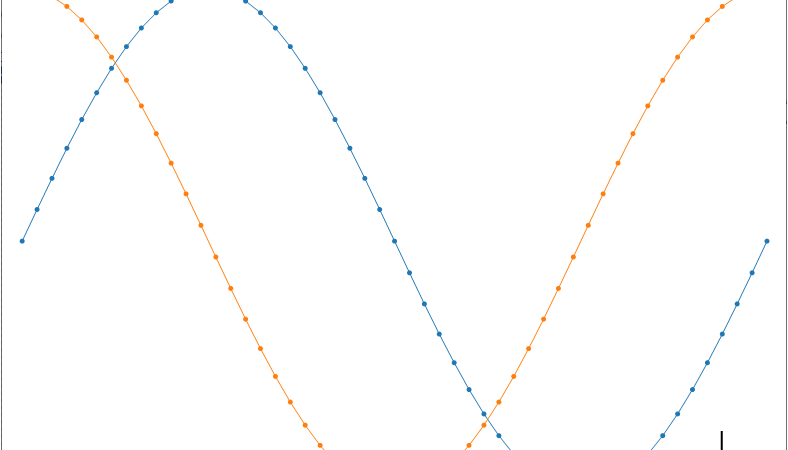
■ Plot 클래스의 AddScaleBar 메소드를 사용해 스케일 바를 표시하는 방법을 보여준다. ▶ MainForm.cs
1 2 3 4 5 6 7 8 9 10 11 12 13 14 15 16 17 18 19 20 21 22 23 24 25 26 27 28 29 30 31 32 33 34 35 36 37 38 39 40 41 42 43 |
using System.Windows.Forms; using ScottPlot; namespace TestProject { /// <summary> /// 메인 폼 /// </summary> public partial class MainForm : Form { //////////////////////////////////////////////////////////////////////////////////////////////////// Constructor ////////////////////////////////////////////////////////////////////////////////////////// Public #region 생성자 - MainForm() /// <summary> /// 생성자 /// </summary> public MainForm() { InitializeComponent(); Plot plot = new Plot(800, 600); plot.AddSignal(DataGen.Sin(51)); plot.AddSignal(DataGen.Cos(51)); plot.Grid(enable : false); plot.Frameless(); plot.AddScaleBar(5, 0.25, "100 ms", "250 mV"); this.formsPlot.Reset(plot); this.formsPlot.Refresh(); } #endregion } } |
TestProject.zip
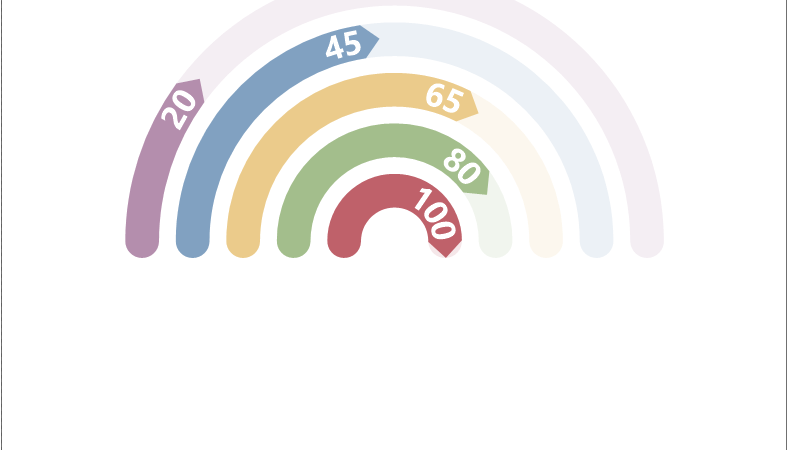
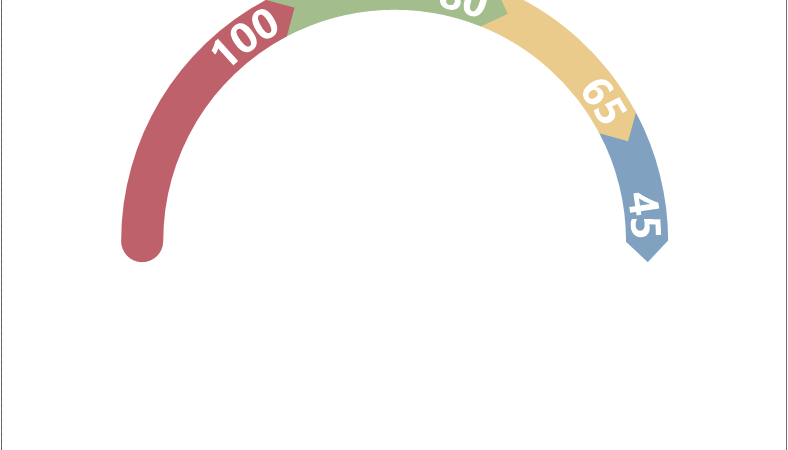
■ RadialGaugePlot 클래스의 CircularBackground/MaximumAngle/StartingAngle 속성을 사용해 배경 게이지를 정규화하는 방법을 보여준다. ▶ MainForm.cs
1 2 3 4 5 6 7 8 9 10 11 12 13 14 15 16 17 18 19 20 21 22 23 24 25 26 27 28 29 30 31 32 33 34 35 36 37 38 39 40 41 42 43 44 45 46 |
using System.Windows.Forms; using ScottPlot; using ScottPlot.Plottable; namespace TestProject { /// <summary> /// 메인 폼 /// </summary> public partial class MainForm : Form { //////////////////////////////////////////////////////////////////////////////////////////////////// Constructor ////////////////////////////////////////////////////////////////////////////////////////// Public #region 생성자 - MainForm() /// <summary> /// 생성자 /// </summary> public MainForm() { InitializeComponent(); Plot plot = new Plot(800, 600); plot.Palette = ScottPlot.Drawing.Palette.Nord; double[] valueArray = { 100, 80, 65, 45, 20 }; RadialGaugePlot radialGaugePlot = plot.AddRadialGauge(valueArray); radialGaugePlot.CircularBackground = false; radialGaugePlot.MaximumAngle = 180; radialGaugePlot.StartingAngle = 180; this.formsPlot.Reset(plot); this.formsPlot.Refresh(); } #endregion } } |
TestProject.zip
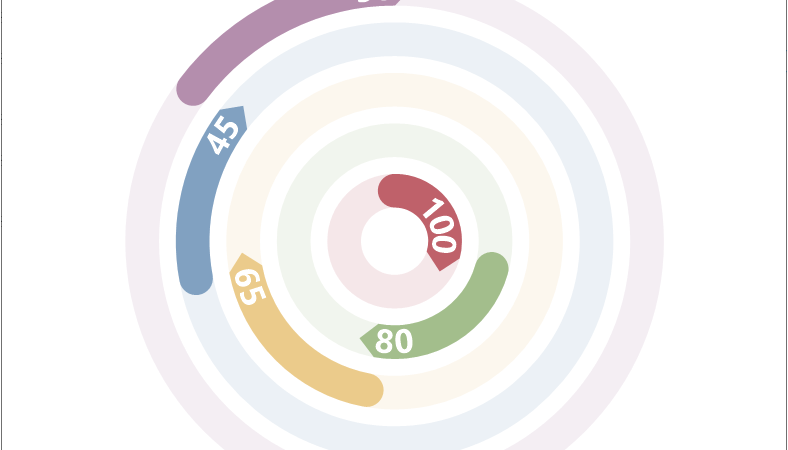
■ RadialGaugePlot 클래스의 BackgroundTransparencyFraction 속성을 사용해 배경 게이지 흐림을 설정하는 방법을 보여준다. ▶ MainForm.cs
1 2 3 4 5 6 7 8 9 10 11 12 13 14 15 16 17 18 19 20 21 22 23 24 25 26 27 28 29 30 31 32 33 34 35 36 37 38 39 40 41 42 43 44 45 46 |
using System.Windows.Forms; using ScottPlot; using ScottPlot.Plottable; namespace TestProject { /// <summary> /// 메인 폼 /// </summary> public partial class MainForm : Form { //////////////////////////////////////////////////////////////////////////////////////////////////// Constructor ////////////////////////////////////////////////////////////////////////////////////////// Public #region 생성자 - MainForm() /// <summary> /// 생성자 /// </summary> public MainForm() { InitializeComponent(); Plot plot = new Plot(800, 600); plot.Palette = ScottPlot.Drawing.Palette.Nord; double[] valueArray = { 100, 80, 65, 45, 20 }; RadialGaugePlot radialGaugePlot = plot.AddRadialGauge(valueArray); radialGaugePlot.BackgroundTransparencyFraction = 0.5; plot.Legend(true); this.formsPlot.Reset(plot); this.formsPlot.Refresh(); } #endregion } } |
TestProject.zip
■ RadialGaugePlot 클래스의 Labels 속성을 사용해 레전드에서 게이지 레이블을 표시하는 방법을 보여준다. ▶ MainForm.cs
1 2 3 4 5 6 7 8 9 10 11 12 13 14 15 16 17 18 19 20 21 22 23 24 25 26 27 28 29 30 31 32 33 34 35 36 37 38 39 40 41 42 43 44 45 46 |
using System.Windows.Forms; using ScottPlot; using ScottPlot.Plottable; namespace TestProject { /// <summary> /// 메인 폼 /// </summary> public partial class MainForm : Form { //////////////////////////////////////////////////////////////////////////////////////////////////// Constructor ////////////////////////////////////////////////////////////////////////////////////////// Public #region 생성자 - MainForm() /// <summary> /// 생성자 /// </summary> public MainForm() { InitializeComponent(); Plot plot = new Plot(800, 600); plot.Palette = ScottPlot.Drawing.Palette.Nord; double[] valueArray = { 100, 80, 65, 45, 20 }; RadialGaugePlot radialGaugePlot = plot.AddRadialGauge(valueArray); radialGaugePlot.Labels = new string[] { "alpha", "beta", "gamma", "delta", "epsilon" }; plot.Legend(true); this.formsPlot.Reset(plot); this.formsPlot.Refresh(); } #endregion } } |
TestProject.zip
■ RadialGaugePlot 클래스의 Font 속성을 사용해 게이지 레이블 색상을 설정하는 방법을 보여준다. ▶ MainForm.cs
1 2 3 4 5 6 7 8 9 10 11 12 13 14 15 16 17 18 19 20 21 22 23 24 25 26 27 28 29 30 31 32 33 34 35 36 37 38 39 40 41 42 43 44 45 |
using System.Drawing; using System.Windows.Forms; using ScottPlot; using ScottPlot.Plottable; namespace TestProject { /// <summary> /// 메인 폼 /// </summary> public partial class MainForm : Form { //////////////////////////////////////////////////////////////////////////////////////////////////// Constructor ////////////////////////////////////////////////////////////////////////////////////////// Public #region 생성자 - MainForm() /// <summary> /// 생성자 /// </summary> public MainForm() { InitializeComponent(); Plot plot = new Plot(800, 600); plot.Palette = ScottPlot.Drawing.Palette.Nord; double[] valueArray = { 100, 80, 65, 45, 20 }; RadialGaugePlot radialGaugePlot = plot.AddRadialGauge(valueArray); radialGaugePlot.Font.Color = Color.Black; this.formsPlot.Reset(plot); this.formsPlot.Refresh(); } #endregion } } |
TestProject.zip
■ RadialGaugePlot 클래스의 FontSizeFraction 속성을 사용해 게이지 레이블 폰트 비율을 설정하는 방법을 보여준다. ▶ MainForm.cs
1 2 3 4 5 6 7 8 9 10 11 12 13 14 15 16 17 18 19 20 21 22 23 24 25 26 27 28 29 30 31 32 33 34 35 36 37 38 39 40 41 42 43 44 |
using System.Windows.Forms; using ScottPlot; using ScottPlot.Plottable; namespace TestProject { /// <summary> /// 메인 폼 /// </summary> public partial class MainForm : Form { //////////////////////////////////////////////////////////////////////////////////////////////////// Constructor ////////////////////////////////////////////////////////////////////////////////////////// Public #region 생성자 - MainForm() /// <summary> /// 생성자 /// </summary> public MainForm() { InitializeComponent(); Plot plot = new Plot(800, 600); plot.Palette = ScottPlot.Drawing.Palette.Nord; double[] valueArray = { 100, 80, 65, 45, 20 }; RadialGaugePlot radialGaugePlot = plot.AddRadialGauge(valueArray); radialGaugePlot.FontSizeFraction = 0.4; this.formsPlot.Reset(plot); this.formsPlot.Refresh(); } #endregion } } |
TestProject.zip
■ RadialGaugePlot 클래스의 LabelPositionFraction 속성을 사용해 게이지 레이블 위치를 설정하는 방법을 보여준다. ▶ MainForm.cs
1 2 3 4 5 6 7 8 9 10 11 12 13 14 15 16 17 18 19 20 21 22 23 24 25 26 27 28 29 30 31 32 33 34 35 36 37 38 39 40 41 42 43 44 |
using System.Windows.Forms; using ScottPlot; using ScottPlot.Plottable; namespace TestProject { /// <summary> /// 메인 폼 /// </summary> public partial class MainForm : Form { //////////////////////////////////////////////////////////////////////////////////////////////////// Constructor ////////////////////////////////////////////////////////////////////////////////////////// Public #region 생성자 - MainForm() /// <summary> /// 생성자 /// </summary> public MainForm() { InitializeComponent(); Plot plot = new Plot(800, 600); plot.Palette = ScottPlot.Drawing.Palette.Nord; double[] valueArray = { 100, 80, 65, 45, 20 }; RadialGaugePlot radialGaugePlot = plot.AddRadialGauge(valueArray); radialGaugePlot.LabelPositionFraction = 0; this.formsPlot.Reset(plot); this.formsPlot.Refresh(); } #endregion } } |
TestProject.zip
■ RadialGaugePlot 클래스의 ShowLevels 속성을 사용해 레이블을 숨기는 방법을 보여준다. ▶ MainForm.cs
1 2 3 4 5 6 7 8 9 10 11 12 13 14 15 16 17 18 19 20 21 22 23 24 25 26 27 28 29 30 31 32 33 34 35 36 37 38 39 40 41 42 43 44 |
using System.Windows.Forms; using ScottPlot; using ScottPlot.Plottable; namespace TestProject { /// <summary> /// 메인 폼 /// </summary> public partial class MainForm : Form { //////////////////////////////////////////////////////////////////////////////////////////////////// Constructor ////////////////////////////////////////////////////////////////////////////////////////// Public #region 생성자 - MainForm() /// <summary> /// 생성자 /// </summary> public MainForm() { InitializeComponent(); Plot plot = new Plot(800, 600); plot.Palette = ScottPlot.Drawing.Palette.Nord; double[] valueArray = { 100, 80, 65, 45, 20 }; RadialGaugePlot radialGaugePlot = plot.AddRadialGauge(valueArray); radialGaugePlot.ShowLevels = false; this.formsPlot.Reset(plot); this.formsPlot.Refresh(); } #endregion } } |
TestProject.zip
■ RadialGaugePlot 클래스의 MaximumAngle 속성을 사용해 게이지 각도 범위를 설정하는 방법을 보여준다. ▶ MainForm.cs
1 2 3 4 5 6 7 8 9 10 11 12 13 14 15 16 17 18 19 20 21 22 23 24 25 26 27 28 29 30 31 32 33 34 35 36 37 38 39 40 41 42 43 44 |
using System.Windows.Forms; using ScottPlot; using ScottPlot.Plottable; namespace TestProject { /// <summary> /// 메인 폼 /// </summary> public partial class MainForm : Form { //////////////////////////////////////////////////////////////////////////////////////////////////// Constructor ////////////////////////////////////////////////////////////////////////////////////////// Public #region 생성자 - MainForm() /// <summary> /// 생성자 /// </summary> public MainForm() { InitializeComponent(); Plot plot = new Plot(800, 600); plot.Palette = ScottPlot.Drawing.Palette.Nord; double[] valueArray = { 100, 80, 65, 45, 20 }; RadialGaugePlot radialGaugePlot = plot.AddRadialGauge(valueArray); radialGaugePlot.MaximumAngle = 180; this.formsPlot.Reset(plot); this.formsPlot.Refresh(); } #endregion } } |
TestProject.zip
■ RadialGaugePlot 클래스의 StartingAngle 속성을 사용해 게이지 시작 각도를 설정하는 방법을 보여준다. ▶ MainForm.cs
1 2 3 4 5 6 7 8 9 10 11 12 13 14 15 16 17 18 19 20 21 22 23 24 25 26 27 28 29 30 31 32 33 34 35 36 37 38 39 40 41 42 43 44 |
using System.Windows.Forms; using ScottPlot; using ScottPlot.Plottable; namespace TestProject { /// <summary> /// 메인 폼 /// </summary> public partial class MainForm : Form { //////////////////////////////////////////////////////////////////////////////////////////////////// Constructor ////////////////////////////////////////////////////////////////////////////////////////// Public #region 생성자 - MainForm() /// <summary> /// 생성자 /// </summary> public MainForm() { InitializeComponent(); Plot plot = new Plot(800, 600); plot.Palette = ScottPlot.Drawing.Palette.Nord; double[] valueArray = { 100, 80, 65, 45, 20 }; RadialGaugePlot radialGaugePlot = plot.AddRadialGauge(valueArray); radialGaugePlot.StartingAngle = 180; this.formsPlot.Reset(plot); this.formsPlot.Refresh(); } #endregion } } |
TestProject.zip
■ RadialGaugePlot 클래스의 StartCap/EndCap 속성을 사용해 게이지 캡을 설정하는 방법을 보여준다. ▶ MainForm.cs
1 2 3 4 5 6 7 8 9 10 11 12 13 14 15 16 17 18 19 20 21 22 23 24 25 26 27 28 29 30 31 32 33 34 35 36 37 38 39 40 41 42 43 44 45 46 47 |
using System.Drawing.Drawing2D; using System.Windows.Forms; using ScottPlot; using ScottPlot.Plottable; namespace TestProject { /// <summary> /// 메인 폼 /// </summary> public partial class MainForm : Form { //////////////////////////////////////////////////////////////////////////////////////////////////// Constructor ////////////////////////////////////////////////////////////////////////////////////////// Public #region 생성자 - MainForm() /// <summary> /// 생성자 /// </summary> public MainForm() { InitializeComponent(); Plot plot = new Plot(800, 600); plot.Palette = ScottPlot.Drawing.Palette.Nord; double[] valueArray = { 100, 80, 65, 45, 20 }; RadialGaugePlot radialGaugePlot = plot.AddRadialGauge(valueArray); radialGaugePlot.CircularBackground = false; radialGaugePlot.StartCap = LineCap.Flat; radialGaugePlot.EndCap = LineCap.DiamondAnchor; this.formsPlot.Reset(plot); this.formsPlot.Refresh(); } #endregion } } |
TestProject.zip
■ RadialGaugePlot 클래스의 SpaceFraction 속성을 사용해 게이지 크기를 설정하는 방법을 보여준다. ▶ MainForm.cs
1 2 3 4 5 6 7 8 9 10 11 12 13 14 15 16 17 18 19 20 21 22 23 24 25 26 27 28 29 30 31 32 33 34 35 36 37 38 39 40 41 42 43 44 |
using System.Windows.Forms; using ScottPlot; using ScottPlot.Plottable; namespace TestProject { /// <summary> /// 메인 폼 /// </summary> public partial class MainForm : Form { //////////////////////////////////////////////////////////////////////////////////////////////////// Constructor ////////////////////////////////////////////////////////////////////////////////////////// Public #region 생성자 - MainForm() /// <summary> /// 생성자 /// </summary> public MainForm() { InitializeComponent(); Plot plot = new Plot(800, 600); plot.Palette = ScottPlot.Drawing.Palette.Nord; double[] valueArray = { 100, 80, 65, 45, 20 }; RadialGaugePlot radialGaugePlot = plot.AddRadialGauge(valueArray); radialGaugePlot.SpaceFraction = 0.05; this.formsPlot.Reset(plot); this.formsPlot.Refresh(); } #endregion } } |
TestProject.zip
■ RadialGaugePlot 클래스의 Clockwise 속성을 사용해 게이지 방향을 설정하는 방법을 보여준다. ▶ MainForm.cs
1 2 3 4 5 6 7 8 9 10 11 12 13 14 15 16 17 18 19 20 21 22 23 24 25 26 27 28 29 30 31 32 33 34 35 36 37 38 39 40 41 42 43 44 |
using System.Windows.Forms; using ScottPlot; using ScottPlot.Plottable; namespace TestProject { /// <summary> /// 메인 폼 /// </summary> public partial class MainForm : Form { //////////////////////////////////////////////////////////////////////////////////////////////////// Constructor ////////////////////////////////////////////////////////////////////////////////////////// Public #region 생성자 - MainForm() /// <summary> /// 생성자 /// </summary> public MainForm() { InitializeComponent(); Plot plot = new Plot(800, 600); plot.Palette = ScottPlot.Drawing.Palette.Nord; double[] valueArray = { 100, 80, 65, 45, 20 }; RadialGaugePlot radialGaugePlot = plot.AddRadialGauge(valueArray); radialGaugePlot.Clockwise = false; this.formsPlot.Reset(plot); this.formsPlot.Refresh(); } #endregion } } |
TestProject.zip
■ RadialGaugePlot 클래스의 GaugeMode/StartingAngle/MaximumAngle 속성을 사용해 단일 게이지 모드를 설정하는 방법을 보여준다. ▶ MainForm.cs
1 2 3 4 5 6 7 8 9 10 11 12 13 14 15 16 17 18 19 20 21 22 23 24 25 26 27 28 29 30 31 32 33 34 35 36 37 38 39 40 41 42 43 44 45 46 |
using System.Windows.Forms; using ScottPlot; using ScottPlot.Plottable; namespace TestProject { /// <summary> /// 메인 폼 /// </summary> public partial class MainForm : Form { //////////////////////////////////////////////////////////////////////////////////////////////////// Constructor ////////////////////////////////////////////////////////////////////////////////////////// Public #region 생성자 - MainForm() /// <summary> /// 생성자 /// </summary> public MainForm() { InitializeComponent(); Plot plot = new Plot(800, 600); plot.Palette = ScottPlot.Drawing.Palette.Nord; double[] valueArray = { 100, 80, 65, 45 }; RadialGaugePlot radialGaugePlot = plot.AddRadialGauge(valueArray); radialGaugePlot.GaugeMode = RadialGaugeMode.SingleGauge; radialGaugePlot.StartingAngle = 180; radialGaugePlot.MaximumAngle = 180; this.formsPlot.Reset(plot); this.formsPlot.Refresh(); } #endregion } } |
TestProject.zip
■ RadialGaugePlot 클래스의 OrderInsideOut 속성을 사용해 반대 방향으로 게이지를 표시하는 방법을 보여준다. ▶ MainForm.cs
1 2 3 4 5 6 7 8 9 10 11 12 13 14 15 16 17 18 19 20 21 22 23 24 25 26 27 28 29 30 31 32 33 34 35 36 37 38 39 40 41 42 43 44 45 |
using System.Windows.Forms; using ScottPlot; using ScottPlot.Plottable; namespace TestProject { /// <summary> /// 메인 폼 /// </summary> public partial class MainForm : Form { //////////////////////////////////////////////////////////////////////////////////////////////////// Constructor ////////////////////////////////////////////////////////////////////////////////////////// Public #region 생성자 - MainForm() /// <summary> /// 생성자 /// </summary> public MainForm() { InitializeComponent(); Plot plot = new Plot(800, 600); plot.Palette = ScottPlot.Drawing.Palette.Nord; double[] valueArray = { 100, 80, 65, 45, 50 }; RadialGaugePlot radialGaugePlot = plot.AddRadialGauge(valueArray); radialGaugePlot.GaugeMode = RadialGaugeMode.Sequential; radialGaugePlot.OrderInsideOut = false; this.formsPlot.Reset(plot); this.formsPlot.Refresh(); } #endregion } } |
TestProject.zip
■ RadialGaugePlot 클래스의 GaugeMode 속성을 사용해 순차 게이지 모드를 설정하는 방법을 보여준다. ▶ MainForm.cs
1 2 3 4 5 6 7 8 9 10 11 12 13 14 15 16 17 18 19 20 21 22 23 24 25 26 27 28 29 30 31 32 33 34 35 36 37 38 39 40 41 42 43 44 |
using System.Windows.Forms; using ScottPlot; using ScottPlot.Plottable; namespace TestProject { /// <summary> /// 메인 폼 /// </summary> public partial class MainForm : Form { //////////////////////////////////////////////////////////////////////////////////////////////////// Constructor ////////////////////////////////////////////////////////////////////////////////////////// Public #region 생성자 - MainForm() /// <summary> /// 생성자 /// </summary> public MainForm() { InitializeComponent(); Plot plot = new Plot(800, 600); plot.Palette = ScottPlot.Drawing.Palette.Nord; double[] valueArray = { 100, 80, 65, 45, 50 }; RadialGaugePlot radialGaugePlot = plot.AddRadialGauge(valueArray); radialGaugePlot.GaugeMode = RadialGaugeMode.Sequential; this.formsPlot.Reset(plot); this.formsPlot.Refresh(); } #endregion } } |
TestProject.zip
■ 방사형 게이지 차트에서 음수 값을 사용하는 방법을 보여준다. ▶ MainForm.cs
1 2 3 4 5 6 7 8 9 10 11 12 13 14 15 16 17 18 19 20 21 22 23 24 25 26 27 28 29 30 31 32 33 34 35 36 37 38 39 40 41 |
using System.Windows.Forms; using ScottPlot; namespace TestProject { /// <summary> /// 메인 폼 /// </summary> public partial class MainForm : Form { //////////////////////////////////////////////////////////////////////////////////////////////////// Constructor ////////////////////////////////////////////////////////////////////////////////////////// Public #region 생성자 - MainForm() /// <summary> /// 생성자 /// </summary> public MainForm() { InitializeComponent(); Plot plot = new Plot(800, 600); plot.Palette = ScottPlot.Drawing.Palette.Nord; double[] valueArray = { 100, 80, -65, 45, -20 }; plot.AddRadialGauge(valueArray); this.formsPlot.Reset(plot); this.formsPlot.Refresh(); } #endregion } } |
TestProject.zip
■ Plot 클래스의 Palette 속성을 사용해 방사형 게이지 색상을 설정하는 방법을 보여준다. ▶ MainForm.cs
1 2 3 4 5 6 7 8 9 10 11 12 13 14 15 16 17 18 19 20 21 22 23 24 25 26 27 28 29 30 31 32 33 34 35 36 37 38 39 40 41 |
using System.Windows.Forms; using ScottPlot; namespace TestProject { /// <summary> /// 메인 폼 /// </summary> public partial class MainForm : Form { //////////////////////////////////////////////////////////////////////////////////////////////////// Constructor ////////////////////////////////////////////////////////////////////////////////////////// Public #region 생성자 - MainForm() /// <summary> /// 생성자 /// </summary> public MainForm() { InitializeComponent(); Plot plot = new Plot(800, 600); double[] valueArray = { 100, 80, 65, 45, 20 }; plot.Palette = ScottPlot.Drawing.Palette.Nord; plot.AddRadialGauge(valueArray); this.formsPlot.Reset(plot); this.formsPlot.Refresh(); } #endregion } } |
TestProject.zip
■ Plot 클래스의 AddRadialGauge 메소드를 사용해 방사형 게이지 차트를 그리는 방법을 보여준다. ▶ MainForm.cs
1 2 3 4 5 6 7 8 9 10 11 12 13 14 15 16 17 18 19 20 21 22 23 24 25 26 27 28 29 30 31 32 33 34 35 36 37 38 39 |
using System.Windows.Forms; using ScottPlot; namespace TestProject { /// <summary> /// 메인 폼 /// </summary> public partial class MainForm : Form { //////////////////////////////////////////////////////////////////////////////////////////////////// Constructor ////////////////////////////////////////////////////////////////////////////////////////// Public #region 생성자 - MainForm() /// <summary> /// 생성자 /// </summary> public MainForm() { InitializeComponent(); Plot plot = new Plot(800, 600); double[] valueArray = { 100, 80, 65, 45, 20 }; plot.AddRadialGauge(valueArray); this.formsPlot.Reset(plot); this.formsPlot.Refresh(); } #endregion } } |
TestProject.zip


