using System.Drawing;
using System.Windows.Forms;
using ScottPlot;
using ScottPlot.Plottable;
namespace TestProject
{
/// <summary>
/// 메인 폼
/// </summary>
public partial class MainForm : Form
{
//////////////////////////////////////////////////////////////////////////////////////////////////// Constructor
////////////////////////////////////////////////////////////////////////////////////////// Public
#region 생성자 - MainForm()
/// <summary>
/// 생성자
/// </summary>
public MainForm()
{
InitializeComponent();
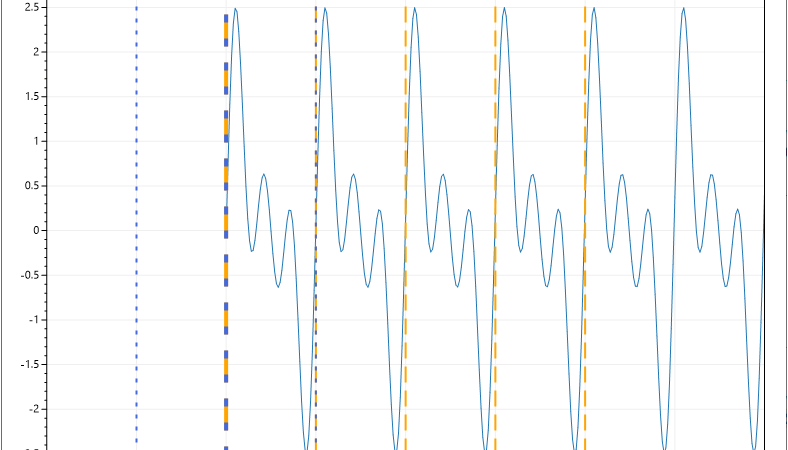
Plot plot = new Plot(800, 600);
int sampleCount = 500;
double[] signalArray1 = DataGen.Sin(sampleCount, 10);
double[] signalArray2 = DataGen.Sin(sampleCount, 20);
double[] signalArray3 = DataGen.Sin(sampleCount, 30);
double[] signal = new double[sampleCount];
for(int index = 0; index < sampleCount; index++)
{
signal[index] = signalArray1[index] + signalArray2[index] + signalArray3[index];
}
plot.AddSignal(signal);
RepeatingVLine repeatingVLine1 = new RepeatingVLine();
repeatingVLine1.LineWidth = 2;
repeatingVLine1.LineStyle = LineStyle.Dash;
repeatingVLine1.Color = Color.Magenta;
repeatingVLine1.PositionLabel = true;
repeatingVLine1.PositionLabelBackground = repeatingVLine1.Color;
repeatingVLine1.DragEnabled = true;
repeatingVLine1.relativeposition = false;
repeatingVLine1.shift = 50;
repeatingVLine1.count = 5;
plot.Add(repeatingVLine1);
RepeatingVLine repeatingVLine2 = new RepeatingVLine();
repeatingVLine2.LineWidth = 2;
repeatingVLine2.LineStyle = LineStyle.Dot;
repeatingVLine2.Color = Color.DarkGreen;
repeatingVLine2.PositionLabel = true;
repeatingVLine2.PositionLabelBackground = repeatingVLine2.Color;
repeatingVLine2.DragEnabled = true;
repeatingVLine2.relativeposition = false;
repeatingVLine2.offset = -1;
repeatingVLine2.shift = 50;
repeatingVLine2.count = 3;
plot.Add(repeatingVLine2);
plot.SetAxisLimitsX(-100, 300);
this.formsPlot.Reset(plot);
this.formsPlot.Refresh();
}
#endregion
}
}

